HortCarbon Info"Better information drives better management decisions" |
Funded by the
|

HortCarbon Info is a Web tool which can be used to calculate greenhouse gas (GHG) emissions from most Horticultural growing operations.
The final report for this tool can be found here.
Emission Factors have been updated using Australian National Greenhouse Factors August 2024
The original HortCarbonInfo Excel spreadsheet was created in 2008 by Peter Deuter, Principal Horticulturist, Queensland Department of Primary Industries (QDPI), Gatton Research Station, as part of the project - "Improving the Capacity of Queensland Intensive Agriculture to Manage Climate Change", a Queensland Farmers Federation (Growcom & NGIQ) project funded by DAFF Australia and has been updated many times since.
In 2009, a version (BananaCarbonInfo) was developed for the Australian Banana Industry in a project - "Understanding and Identifying the Threats and Opportunities for the Banana Industry Posed by Climate Change", funded by Horticulture Australia Limited and QDPI; and in the same year a version, (MushroomCarbonInfo) was developed for the Australian Mushroom Industry.
The most common boundary is the farm boundary, and period of time is a year, so the greenhouse gas emissions which are calculated using this tool are those created by on-farm operations for one year. Most of these operations can be influenced to varying degrees by growers. A different boundary and/or period of time can be selected by the user.
Greenhouse gas emissions from the manufacture and transport of inputs for horticultural production are not included in this Web tool. Nor are the emissions associated with transport and marketing of horticultural crops which are sold through wholesale and retail outlets. A Life Cycle Analysis needs to be undertaken to account for the emissions from these sources.
Additional information has been provided to assist in the understanding of GHG emissions, and how these might be reduced or mitigated, and to explain some of the uncertainties associated with calculating and reducing emissions.
The emission factors used in this tool are updated each year from National Greenhouse Accounts (NGA) Factors. The most recent being August 2024.
HortCarbon Info has the following limitations:
- Greenhouse gas emissions are calculated for electricity, fuel, fertilizer, dolomite and lime, crop residues, refrigeration leakage and on-farm waste. Other sources of greenhouse gasses exist on farms, including waste water. HortCarbon Info probably accounts for more than 95% of the greenhouse gas emissions created in a growing operation, so in the absence of a more comprehensive tool, the results will provide a very good understanding of the carbon footprint of a horticultural farming operation.
- The emission factors utilised in this Web tool are those which are available from published data, allowing a standard, science based assessment method. The limitations associated with the use of the emission factors for nitrogen fertilizers and other inputs are well known.
Project Leader – David Carey, Senior Horticulturist, Horticulture and Forestry Science, DAF Qld
Project Team Members – Peter Deuter, Horticultural Consultant, PLD Horticulture; Yiru Chen, Horticulturist, Horticulture & Forestry Science, DAF; and Dr Neil White, Principal Scientist, Horticulture and Forestry Science, DAF Qld
HortCarbon Info is a tool to calculate Greenhouse Gas (GHG) Emissions from a Horticultural farming system.
1. Collect the necessary Data - the majority of data will be found in the farm records.
Some of this is not in the form required by HortCarbon Info (e.g. - electricity is mostly recorded as a $ amount, because it is used in financial recording, but HortCarbon Info needs the Electricity data in kWh (kilowatt Hours). This information is readily obtained from the actual Electricity Accounts. It is also very important to record the STATE or TERRITORY, as the emission factor for electricity is different for each Australian State, because of the energy source used in generating electricity (black coal, brown coal, hydro, etc.).
The following is a list of all the Data which HortCarbon Info can utilise in calculating a Carbon Footprint. Not all of these inputs are used by all horticultural businesses, so not all of this data will be required to be collected and entered into HortCarbon Info:
- Electricity (kilowatt Hours - kWh)
- Fuel (litres - L) - all fuel (mostly Diesel and Petrol, but also includes LP gas) used on farm. Fuel also has to be divided into that which is used in stationary appliances such as Irrigation pumping and/or electricity generation on farm; and vehicles such as tractors, utes and bikes used on farm.
- Fertilizer (tonnes - t) - only fertilizers containing nitrogen are included, as only nitrogenous fertilizers are capable of producing greenhouse gasses. If Urea is applied, it needs to be listed separately.
- Animal Manures or Composts (tonnes - t) - the % of nitrogen (usually from a laboratory analysis provided by the supplier) is required.
- On-farm Waste (tonnes - t) - this will mostly be in the form of Green Waste (which may be returned to the field and incorporated), or Paper and Cardboard, and/or Commercial and Industrial Waste which are taken to a Council landfill or recycling facility.
- Refrigeration Gas Leakage (kilograms - kg) - the data required here is the quantity and type of refrigerant used to charge the system (this data is usually found on the Compressor).
- List of Crops, the Area (hectares - ha) planted, and the Yield (Tonnes/Ha) - this data is required to calculate the amount of crop residue which is returned to the soil. This data is also used to calculate Greenhouse Gas Emissions per Tonne of Product sold (an important Index for comparison with other agricultural industries such as Grains and Grazing).
- Lime or Dolomite (tonnes - t).
- Staff Employed Number on pay roll (include combined farm casual hours as a full time equivalents) and $ Turnover (millions of $'s) - these are optional. These data will be used to calculate Greenhouse Gas Emissions per Employee AND Greenhouse Gas Emissions per $M Turnover (important Indices for comparison with other agricultural industries such as Grains and Grazing).
2a. - Determine the "Boundary" - the simplest boundary is the entire farm. This is because most of the activities within the boundary of the farm can be understood and influenced by the business owner or manager of the farm.
Activities outside the farm boundary are usually not under the control of the business owner or manager of the farm, and the data required to calculate the GHG emissions from these off-farm activities are sometimes difficult to find.
2b. - The other boundary is "time". The simplest time period is one financial year.
3. - Enter the Data - Depending on the data you have, not all cells need to be completed.
4. - When all the data you have has been entered, then Calculate and view the Results.
5. - A question which might then be asked is - "What are the main source(s) of Greenhouse Gases (GHG's), and how might these emissions be reduced"?
Additional information is included in attempt to answers these questions.
Step 1. Boundary
Step 2. Non-transport energy use
2.a Electricity
State or Territory
|
|
|
Meter 1:
|
|
2.b Stationary farm operations (fuel)
|
Petrol usage (L)
|
|
|
Diesel usage (L)
|
|
|
LPG usage (L)
|
|
Step 3. Transport energy use
|
Petrol usage (L)
|
|
|
Diesel usage (L)
|
|
|
LPG usage (L)
|
|
Step 4. Fertilizer use
4.a Nitrogenous fertilizer
4.b Animal Manures
Step 5. Waste
Step 6. Refrigeration
Step 7. Crops and area planted
Fruit crops - e.g. Avocados
Vegetable crops - e.g. Carrots
Cover crops / Forage crops
Step 8. Animals (Cattle only)
Step 9. Lime (or Dolomite)
|
Lime usage (tonnes)
|
|
|
Dolomite usage (tonnes)
|
|
Optional Step 10. Input more information to compare GHG emissions
|
Total employee number:
|
|
|
Annual turnover in million ($):
|
|
Trees and Carbon Sequestration.
Carbon is an element, and the building block of all living things on earth. It is continuously cycled through plants and animals and exchanged with the atmosphere.
As a forest grows the plants take carbon dioxide from the atmosphere and convert it to carbon stored in their leaves, branches and trunks by a process called Photosynthesis. Forests store carbon in several 'pools' including in living plant tissues, dead trees and shrubs, woody debris on the forest floor, and the soil.
Approximately half the dry weight of a living tree is carbon, stored for the life of the tree.
When forests are cut down and burnt or left to decay, the carbon in the trees and woody debris is released back into the atmosphere. A significant part of the forest's soil carbon is also released. Grasses and pastures also take carbon from the atmosphere as they grow but they only store a fraction of the carbon that a forest can store.
A considerable portion of the carbon that is taken up by trees will be released again if/when the tree dies and decomposes. Trees are a part of the carbon cycle as they grow, mature, then die and break down and decompose.
The amount of carbon they absorb and store depends on the species, age, the climate the trees live in, the location and the quality of the growing seasons, etc.
The Intergovernmental Panel on Climate Change (IPCC) estimates a sequestration rate of 4.7 tonnes of carbon per hectare per year (i.e. 17t CO2-e per ha per year)
[1 kg of carbon biomass translates to 3.67 kg CO2 removed from the atmosphere]
A number of models have been developed to estimate carbon abatement from native forest regrowth.
1. Reafforestation by Environmental Plantings could deliver 15t CO2-e /ha/year.
The Reforestation by Environmental Plantings action involves establishing and maintaining native vegetation such as trees on land that has been clear of forest for at least five years. Plantings can either be a mix of trees, shrubs and understory species native to the local area. Projects are required to meet a 'permanence obligation', meaning that the carbon stored in plants will remain stored for at least 25 years.
2. Human-induced Regeneration of a Permanent even-aged Native Forest could deliver 8t CO2-e /ha/year.
For the Human-induced Regeneration of a Permanent even-aged Native Forest the application must include evidence that for at least the last 10 years the land has been non-forest and that current management prevents native forest cover. Activities within this method include management to exclude livestock, and changes to livestock grazing patterns and feed regimes. Other activities include managing non-native plant species in the area and stopping actions that prevent native regrowth, such as vegetation clearing. Regeneration must arise from existing natural seed beds, rootstocks or lignotubers in the project area. Projects are required to meet a 'permanence obligation' meaning that the carbon stored in plants will remain stored for at least 25 years.
** LOOC-C is the Landscape Options and Opportunities for Carbon abatement Calculator (LOOC-C) developed by the Commonwealth Scientific and Industrial Research Organisation (CSIRO). It allows you to quickly assess what Emissions Reduction Fund might be right for your land and provides you with estimates of what carbon increases are possible based on project size, land condition, and method.
To be able to sequester 100t CO2-e each year, a grower will need to establish 6.6ha of native vegetation and maintain this planting for at least 25 years. At some point the amount of carbon sequestered will be equal to the amount of carbon released back into the atmosphere through decomposition of leaves, branches and roots. i.e. these trees will no longer be sequestering carbon. They will be cycling carbon. At this point another 6.6ha will need to be established and maintained to be able to continue to sequester 100t CO2-e each year. The timing of this will depend on the species, age, climate the trees live in, location and the quality of the growing seasons. This could vary from 20 to 40 years.
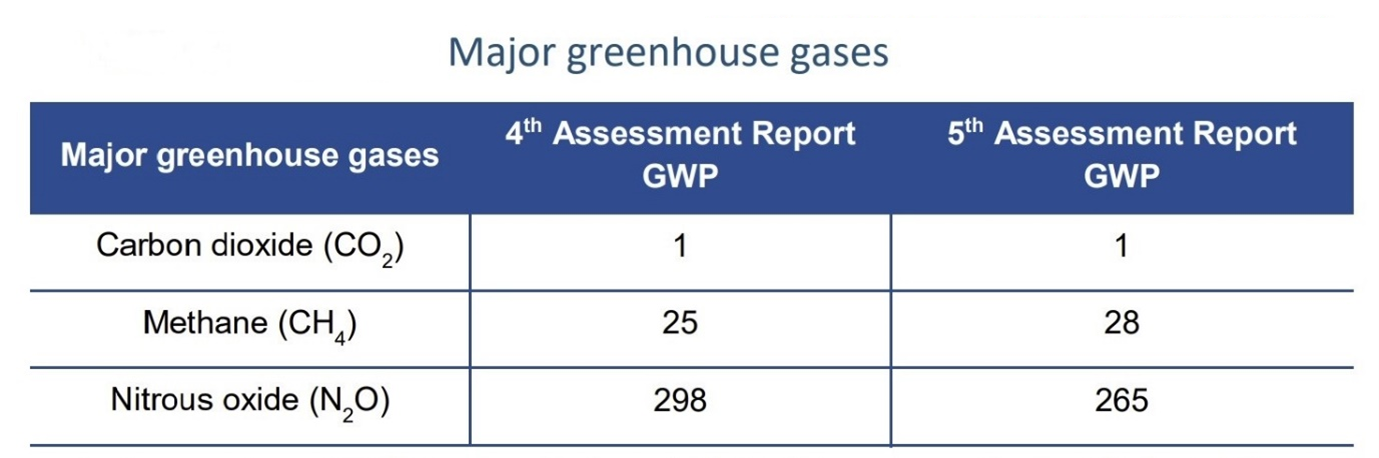
tCO2-e -This is an abbreviation for tonnes of carbon dioxide equivalent. The various greenhouse gases differ in their effects on the climate, so to make calculations easier, the amounts of these gases are converted into an equivalent amount of carbon dioxide with the same effect on warming potential. While carbon dioxide is the primary greenhouse gas emitted through human activities, others include methane, nitrous oxide, and some other gases with industrial applications.
Greenhouse Gas Emissions from Horticultural Farming Practices.
Nitrous oxide (N2O) is the most important greenhouse gas (GHG), from a horticultural perspective, and reductions in N2O emissions from soils can be achieved through the use of management practices which can also improve farming efficiencies.
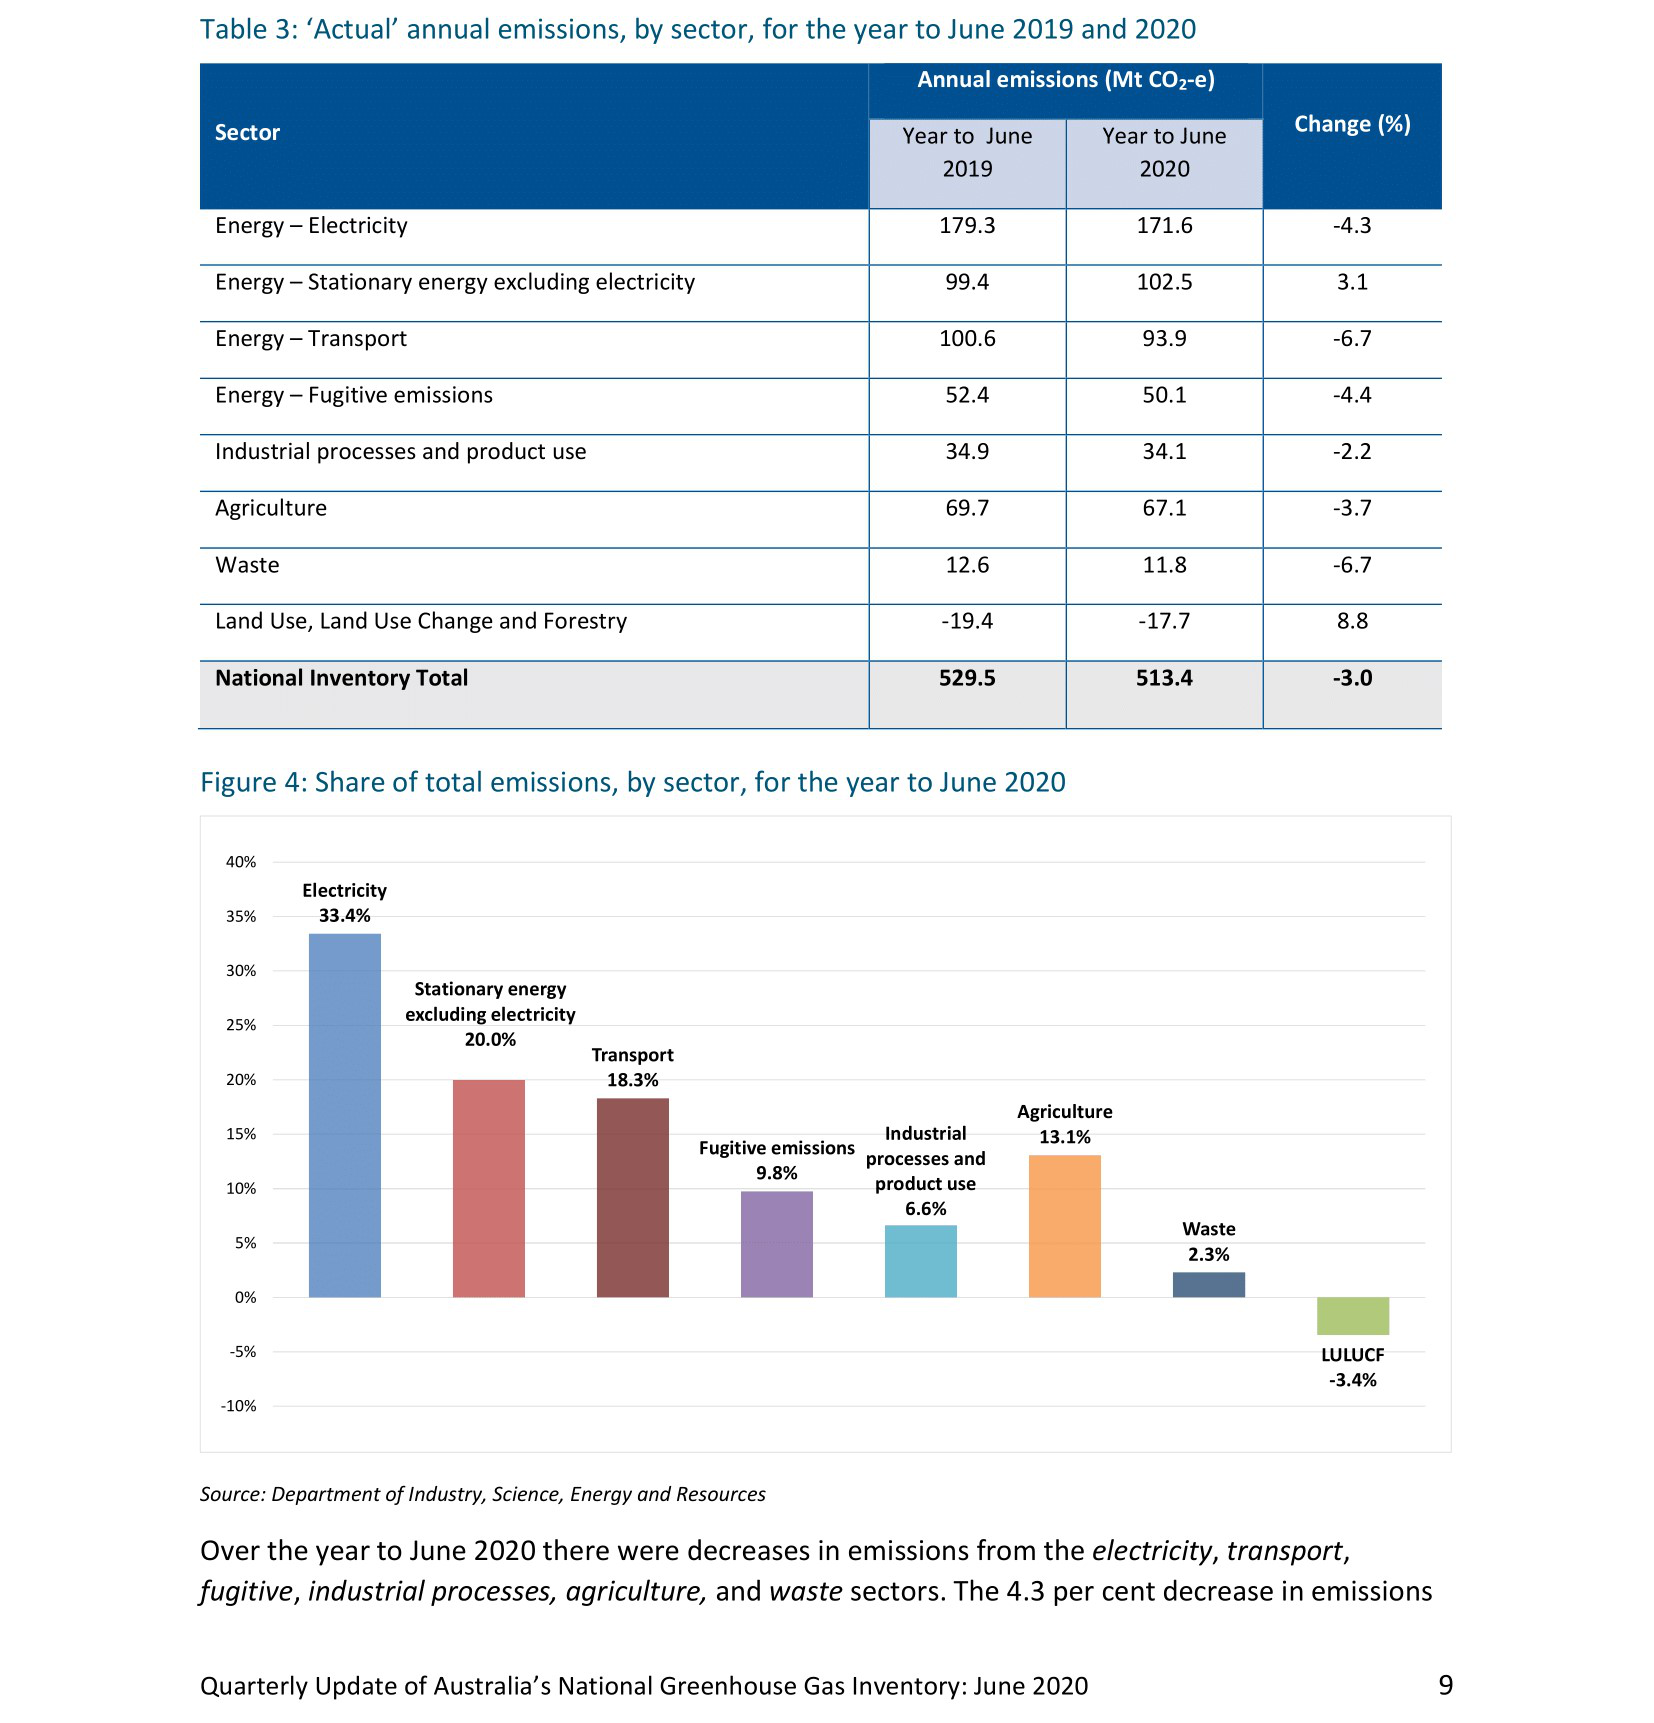
The main GHG's directly emitted from agriculture are methane (CH4), mostly though enteric fermentation from ruminant animals, and N2O lost from nitrogen fertilisers and animal excreta. Agriculture accounts for 60% and 85% of Australia's total methane and nitrous oxide emissions, respectively (NGGI 2020). 16% of nitrous oxide emissions from agriculture are from the use of nitrogen fertiliser, and a further 21% from nitrogen in animal excreta. The indirect emissions from agriculture relate to the use of transport and stationary energy, and contribute ~11% of national GHG emissions. These indirect emissions are accounted for by the stationary energy and transport sectors.
Nitrous oxide is emitted from soils during cultivation, and the use of nitrogen fertilisers (including animal manures). N2O is formed mainly through the process of denitrification, a conversion of mostly nitrate into either nitrogen gas (N2) or nitrous oxide.
Denitrification occurs most rapidly when soils are warm and wet, and when there are large amounts of nitrate and carbon available in the soil.
Any practice which supplies excessive nitrogen to the soil can lead to large losses of nitrogen, including losses through the formation of nitrous oxide.
Estimates of N2O emissions are contained in Australia's National Greenhouse Gas Inventory and the Intergovernmental Panel on Climate Change (IPCC). Experimentation and measurement are difficult and expensive, so these estimates will take some time to be confirmed or changed.
Greenhouse Gases
Management Practices to Reduce N2O Emissions
While actual N2O emissions are relatively small in Australian horticulture, reduction is possible through improved fertiliser use, and crop and soil management.
Where nitrogen fertiliser is applied at high rates, especially when plant requirements are exceeded, losses in the form of N2 and N2O are likely. If conditions can be created which result in nitrogen being used more efficiently, then less nitrogen will be lost, and less N2O will be produced.
1. Fertiliser Management
- Source, Timing and Rate of Nitrogen Fertilizer Applications
In the past, over-fertilising was often practiced, as the additional fertilizer costs were significantly less than the value of potential increased crop yield. This practice has changed as fertilizer prices increase rapidly, and environmental issues such as nitrate contamination of waterways, require a different management practice to be utilized. The additional driver of reducing N2O emissions will also impact on this type of decision making.
The objective of fertilizer management is to maintain low levels of mineral nitrogen in the soil when there is little or no plant growth occurring, by adjusting the rate and timing of nitrogen fertilizer application so as to leave as little residual nitrogen as possible in the soil during any non-cropped periods. This can be achieved by matching the supply of nitrogen (fertilizer rate and timing) with crop needs through the use of:
a) soil/plant testing to determine fertiliser nitrogen needs of the crop.
b) minimising non-crop periods where soil nitrogen can accumulate and be lost.
c) split fertilizer applications according to nutrient requirements and the growth and development of the crop.
Source - Nitrogen fertilizers based on nitrate nitrogen (e.g. ammonium nitrate, potassium nitrate, calcium ammonium nitrate) have a higher potential for denitrification than do fertilizers based on ammonia sources (e.g. urea, DAP, ammonium sulphate). This is especially the case if applied under cold and wet conditions, when soils are waterlogged.
Timing & Rate - Apply nitrogen when crop can utilise it, and apply an amount which does not limit yield potential. Avoid excessive nitrogen fertiliser rates.
Avoid high nitrogen rates when soils are wet (waterlogged). Denitrification is highest under anaerobic and warm soil conditions.
- Irrigation
Irrigation systems in many horticultural crops offer an opportunity to adjust the rate and timing of nitrogen fertilizer through supplying fertiliser nitrogen along with the irrigation water. This is especially the case for trickle and micro-jet systems.
- Fertiliser Placement
Very little nitrogen is lost from foliar applied urea, compared with soil applied urea, unless rainfall washes urea on to the soil. Similarly, nitrogen fertilizer placed below the soil surface will reduce and slow down the denitrification process, as well as reduce the amount of ammonia escaping into the atmosphere.
- Coated Fertilisers
There are a number of nitrification inhibitors (e.g. dicyandiamide (DCD)) that can be applied to nitrogen fertilisers which can reduce denitrification. These products add to the costs of fertilizers, and further research is required to evaluate the cost-effectiveness of this technique. Large reductions in the emission of nitrous oxide have been achieved using polyolefin-coated ammonium nitrate and ammonium sulphate in place of uncoated fertiliser nitrogen.
- Controlled - Release Fertilizers
Technologies for coating or impregnating fertiliser products to control the release of nitrogen are available to improve efficiency of fertilizer application. A number of coated slow-release fertilizer products are available to Australian producers, though pricing is currently slowing product uptake.
2. Crop Management
- Cover crops
Non-leguminous cover crops will utilise nitrogen remaining in soil after a cash crop. These cover crops will reduce nitrate loss from leaching and denitrification losses.
- Water Use Efficiency (WUE)
Technologies are available to improve WUE, thus reduce the opportunity for waterlogging to occur, and then the subsequent denitrification and leaching of nitrates.
3. Soil Management
- Tillage
All tillage operations affect soil organic matter by increasing the mineralisation of organic nitrogen. As a result, more nitrates become available and therefore susceptible to denitrification. When soil nitrate levels exceed the needs of the crop, N2O emissions are likely.
- Soil Compaction
Higher nitrous oxide losses occur when soils are compacted. Compacted soils, which occur from wheeled traffic, especially under wet conditions, are then more subject to denitrification.
Soil Carbon Sequestration - awareness/overview information.
Soil carbon sequestration potential in intensive Horticultural production systems is limited by several management practices that are currently standard practice - viz. tillage for crop establishment, weed control and residue incorporation; fertilizer and irrigation to maximise production; short fallow periods between cash crops, with limited or no pasture phase.
Horticultural businesses are already actively managing the inputs of fertilizer and irrigation, because of the need to maximise productivity while carefully controlling input costs in these high input systems. Other changes which will contribute to achieving this potential are:
- Reduced tillage (reduces carbon losses). Permanent Beds and Controlled Traffic systems are often incorporated to enable this change to be achieved in intensive vegetable production systems. Most fruit tree cropping systems already incorporate reduced (or zero tillage).
- Reducing bare fallow between cash crops (reduces carbon losses).
- Increasing organic amendments such as green manure crops, animal manures, compost, biochar, etc. (increases carbon input).
- Introduction of a pasture phase (reduces carbon losses and increases carbon input). Most intensive vegetable production systems are limited in their ability to have longer-term cover crops or a pasture phase incorporated into the rotation. Most of these production systems are conducted on high-value land and deliver a product to markets that require consistent high-quality supply. Therefore, these high turnover production systems are very intensive in nature and not suited to a rotation using pastures.
Scope 1
Emissions (on farm): include all direct greenhouse gas emissions from sources that are within the business control boundary, as a direct result of on-farm activities. Scope 1 emissions are sometimes called "direct emissions".
Scope 2
Emissions (off farm): energy produced outside the business control boundary but used within the farming operation. Scope 2 "Indirect emissions" come from the use of electricity on-farm, but generated off-farm at a power station.
Scope 3
Indirect emissions that occur as a result of the activities from sources outside the farm boundary and control.
We're not calculating emissions outside the the business control boundary.
Web Sources
Non-Transport Energy (Stationary Energy)
Electricity (Stationary Energy)
Equation: National Greenhouse Accounts Factors 2021, Page 19 (Section 2.3.2).
Emission factors: National Greenhouse Accounts Factors 2021, Page 19 (Table 5).
Fuel (Stationary Energy)
Equation: National Greenhouse Accounts Factors 2021, Page 13 (Section 2.1.3).
Emission factors: National Greenhouse Accounts Factors 2021, Page 14 (Table 3).
Transport Energy
Fuel (Transport Energy)
Equation: National Greenhouse Accounts Factors 2021, Page 15 (Section 2.2).
Emission factors: National Greenhouse Accounts Factors 2021, Page 16 (Table 4).
Direct N2O Emissions from soils
Inorganic Fertilizers
Equation: 2006 IPCC Guidelines, Page 11.10.
Emission factors: National Inventory Report 2019, Page 346 (Table 5.25).
Animal Manures and Composts
Same calculation and EF as for Inorganic Fertilizers
Urea
Equation and Emission Factors: National Inventory Report 2019, Page 362 (Table 5.10).
Waste
Equation: National Greenhouse Accounts Factors 2021, Page 81.
Emission factors: National Greenhouse Accounts Factors 2021, Page 81 and 83 (Table 47 and 49).
Refrigeration (Leakage)
Equation: National Greenhouse Accounts Factors 2021, Page 57.
Emission factors: National Greenhouse Accounts Factors 2021, Page 57 (Table 30).
Lime and Dolomite
Equation: 2006 IPCC Guidelines, Page 11.27 (Section 11.3.1).
Emission factors: 2006 IPCC Guidelines, Page 11.27 (Step 2).
Indirect N2O Emissions from soils
Atmospheric Deposition
Equation: 2006 IPCC Guidelines, Page 11.21 (Equation 11.9) and National Inventory Report 2019, Page 352 (Equation 3DB_1).
Emission factors: National Inventory Report 2019, Page 352 (Section 5.6.9 - IPCC default emission factors) and 2006 IPCC Guidelines, Page 11.24 (Table 11.3).
Nitrogen Leaching and Runoff from the Soil
Equation: 2006 IPCC Guidelines, Page 11.21 and 11.22 (Equation 11.10) and National Inventory Report 2019, Page 355 (Equation 3DB_5).
Emission factors: National Inventory Report 2019, Page 404 (Table 5.J.1) and 2019 Refinement to the 2006 IPCC Guidelines, Page 11.26 (Table 11.3)
Nitrous Oxide Emissions from Crop Residues
Equation: National Inventory Report 2019, Page 349 (Equation 3DA_7).
Emission factors: 2019 Refinement to the 2006 IPCC Guidelines, Page 11.17 (Table 11.1a - Generic Values).
How does your mixed vegetable farm emissions footprint compare to other mixed vegetable farms businesses of a similar size?
Indicative emissions comparison by mixed-vegetable farm size, expressed as tonnes of CO2 equivalent (tonnes CO2-e)
CO2 equivalent (tonnes CO2-e) "carbon dioxide-equivalents" is the standard metric used to quantify GHG emissions. This is the metric adopted by the United Nations Framework Convention on Climate Change (UNFCCC); is used in official GHG reporting and target-setting by countries and institutions; and is the most widely adopted metric used within the scientific literature.
Reference: Hannah Ritchie, Max Roser and Pablo Rosado (2020) - "CO2 and Greenhouse Gas Emissions". Published online at OurWorldInData.org. Retrieved from: https://ourworldindata.org/co2-and-other-greenhouse-gas-emissions [Online Resource]
Data Sources:
# Output data for a range of horticultural farms during the development of the HortCarbon Info Web Tool.
* Output data for dairy, grain & pulse crops and rangeland beef from recent Australian published literature
Reference
* Eckard , R. Primary Industries Climate Challenges Centre ( University of Melbourne) - for comparison dairy, grain and rangeland beef emissions data. [Online Resource]